This old indicator is common in conventional and futures trading. The RSI indicator is a widely used indicator for digital currency analysts in the world.
How does the RSI indicator work?
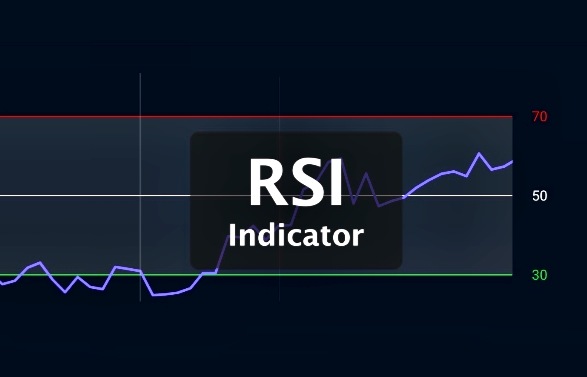
How this old indicator works is easy, just use it in your transactions. If you analyze on the Trading View site, you can add this indicator to the chart from the “fx” button on the chart. RSI is displayed at the bottom of the screen. The RSI line moves between 0 and 100. If this line is below 30, it indicates that the stock is oversold and can be supported soon. If the RSI line is above 70, it indicates that the stock is overbought and we can expect to see a sell-off and a price drop soon. If the rsi line is between 30 and 70, the market is neutral or the price is rocketing. This indicator is also more effective. It is usually used in the same ways as we said, but the rsi indicator can also give other signals about the trend. Generally, if divergence occurs in this indicator, you will receive a strong sell or buy signal. Divergence means that the indicator line is not aligned with the price trend line and they move against each other. In the end, we discuss some important points about this indicator. The first point is that you should not limit yourself to this indicator in trading, but use this indicator along with other technical and fundamental analysis tools to get a correct understanding of the trend. The second point is that RSI can send false signals in some cases, so You should carefully check the weak points of this indicator and cover it with strategy and other analytical tools. Another point is that this indicator can show the support and resistance points of a stock, so check carefully how to use this indicator.
V0.002Sa
بازدیدها: 1