Introducing the aroon indicator for futures trading. aroon is an old indicator that is used in financial market transactions including digital currencies.
Aroon was designed in 1995 by Dr. Tushar Chande
This indicator is considered one of the oldest slators. Currently, this tool is used to detect the trend and the strength of a trend in the money markets. The word “aroon” in Sanskrit means night and day, which indicates the contrast and the existence of fluctuations in the market. This indicator consists of two important lines that vary from zero to one hundred. These lines allow you to recognize the trendiness of the price chart and its strength in the upward and downward directions.
aroon up and aroon down
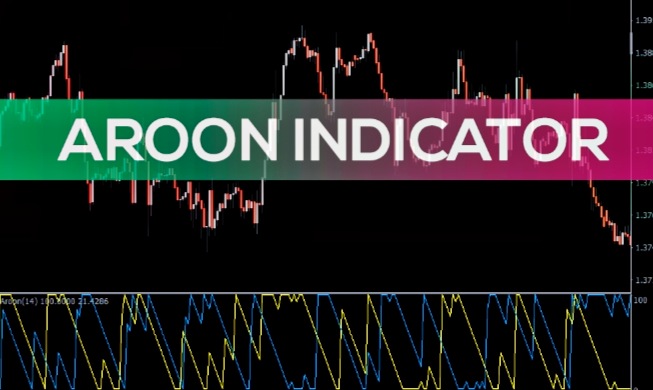
We examine these important lines and their use in the aroon indicator. In most charts, when we implement the aroon indicator on the chart, these lines are displayed at the bottom of the chart, where aroon up is blue and aroon down is orange. When these two lines cross each other, a signal generally appears. In the upward trend, we check Aroon Up. When we deal with the upward chart, Aroon Up is one of the important components of the Aroon indicator to analyze the market trend. it helps. As prices move steadily upwards, the ceiling of the candlesticks gradually rises. Meanwhile, the amount of Aroon Up will also increase continuously, until it reaches the highest possible value, which is 100 units. This indicates that the ceiling of the recent candle also includes the price ceiling of the previous 25 candles.
In a strong uptrend, we can conclude that Aroon Up will reach its maximum of 100 units many times.
Now, to calculate Aroon Up, this indicator is defined as the number of candles that have been away from the price ceiling since the previous time, i.e. 25 candles before. This distance is displayed as a number between zero and 100. Aroon Up value will be zero if the last candle’s ceiling is the most distant from the ceiling of the last 25 candles. In other words, in this case, no candle from the last 25 candles has been far from the recent price ceiling. Conversely, if it has the smallest gap, the Aroon Up value reaches 100 points, indicating a maximum match with the ceiling of the past 25 candles.
But in the downward trend, we examine Aroon Down. In the field of technical analysis, Aroon Down is one of the two basic components of the Aroon indicator, which analyzes the downward trend in the market. When the market is going down, the price floors are constantly falling, and in response to this move, the Aroon Down rises sharply until it reaches its upper limit of 100 units. This indicates that the bottom of the recent candle is in line with the bottom of the last 25 candles.
In a strong downtrend, Aroon Down repeatedly rises to its highs. This phenomenon represents the strength and influence of the downward trend, which is clearly confirmed by Aroon Down. In fact, any increase in the Aroon Down value indicates that the candles have moved down continuously and the bearishness is established in the market.
Now, to calculate Aroon Down, this indicator is defined as the number of candles that have been away from the price floor since the previous time, i.e. 25 candles before. This distance is displayed as a number between zero and 100. If the most recent candle bottom is the most distant from the previous 25 candle bottoms, the Aroon Down value will be zero, indicating no gap to the previous bottoms.
On the contrary, if it has the smallest gap, the value of Aroon Down reaches 100 units, which represents the maximum concordance with the bottom of the last 25 candles. This information helps traders to better understand changes in the downtrend of the market and make more appropriate decisions about entering or exiting the market.
Aron indicator analysis method:
1. Trend identification:
To identify a trend using the Aroon indicator, look at the intersection of the Aroon-Up and Aroon-Down lines in the market. When the Aroon-Up line is above 70 and the Aroon-Down line is below 30, it indicates a strong bullish trend. In other words, in this case, buyers have more power than sellers. Conversely, if the Aroon-Down line is above 70 and the Aroon-Up line is below 30, this indicates a strong bearish trend, which means sellers are dominating buyers.
2. Process Confirmation:
Traders may use the Aaron’s indicator to confirm a trend identified by other technical analysis tools. If both the Aroon-Up and Aroon-Down lines move parallel to each other, this indicates that the market trend is still intact and confirmation is established.
3. Reverse signals:
When the Aroon-Up line crosses below the Aroon-Down line or vice versa, it can indicate a trend reversal signal. For example, if the Aroon-Up line crosses below the Aroon-Down line, this may indicate a change from an uptrend to a downtrend and vice versa.
4. Conditions of overbuying/overselling:
Traders can use Aaron’s indicator to identify overbought or oversold conditions in the market. If any of the lines reach or approach 100, this indicates that prices have reached their trend level and may soon reverse. These conditions may inform traders that the market is in a price divergence situation and indicate a possible entry or exit point.
Advantages and disadvantages of this slitter
This widely used tool has its advantages and disadvantages in futures trading of cryptocurrencies. For this reason, along with this indicator, professional traders use other indicators such as MACD and Hicken Ashi to improve their analysis.
Advantages
- Identify trend changes
- Measure the strength of the trend
- Widely used in adjusting profit limit and loss limit
- Widely used and famous in financial markets
- Simple and understandable and available on various trading platforms
- Can be used with other indicators
Disadvantages
- Too much dependence on past information
- False signals and lack of trend direction
- Sensitivity to price fluctuations
- Limited use
In general, aroon indicator is one of the most used sliders in the field of cryptocurrency. This indicator has been used by crypto industry professionals from the past until today. Do you also use this indicator?
V0.01t
بازدیدها: 11

میخواهی با رمزارز اسانسور خونه ات درست بشه؟
تماس بگیر سرویس کاری صفر تا صد اسانسور